How we did it
The tricky part about making digital maps depicting features from 1917 is that digital maps did not exist at that time. There are no “Halifax 1917” shapefiles or KML files ready to be downloaded and used. Therefore, we had to make our own.
After some research, we discovered the devastated area map that was created after the explosion, based on insurance plans from 1914 and now preserved by the Nova Scotia Archives. Insurance plans documented structures in a community and their locations, for use by the property insurance industry. As such, they provide a detailed record of the buildings that existed at the time. The map was adapted after the explosion to show the extent of destruction from the harbour to Windsor Street and from North to Duffus streets.
The original devastated area map looks like this and is reproduced with permission of the Nova Scotia Archives.
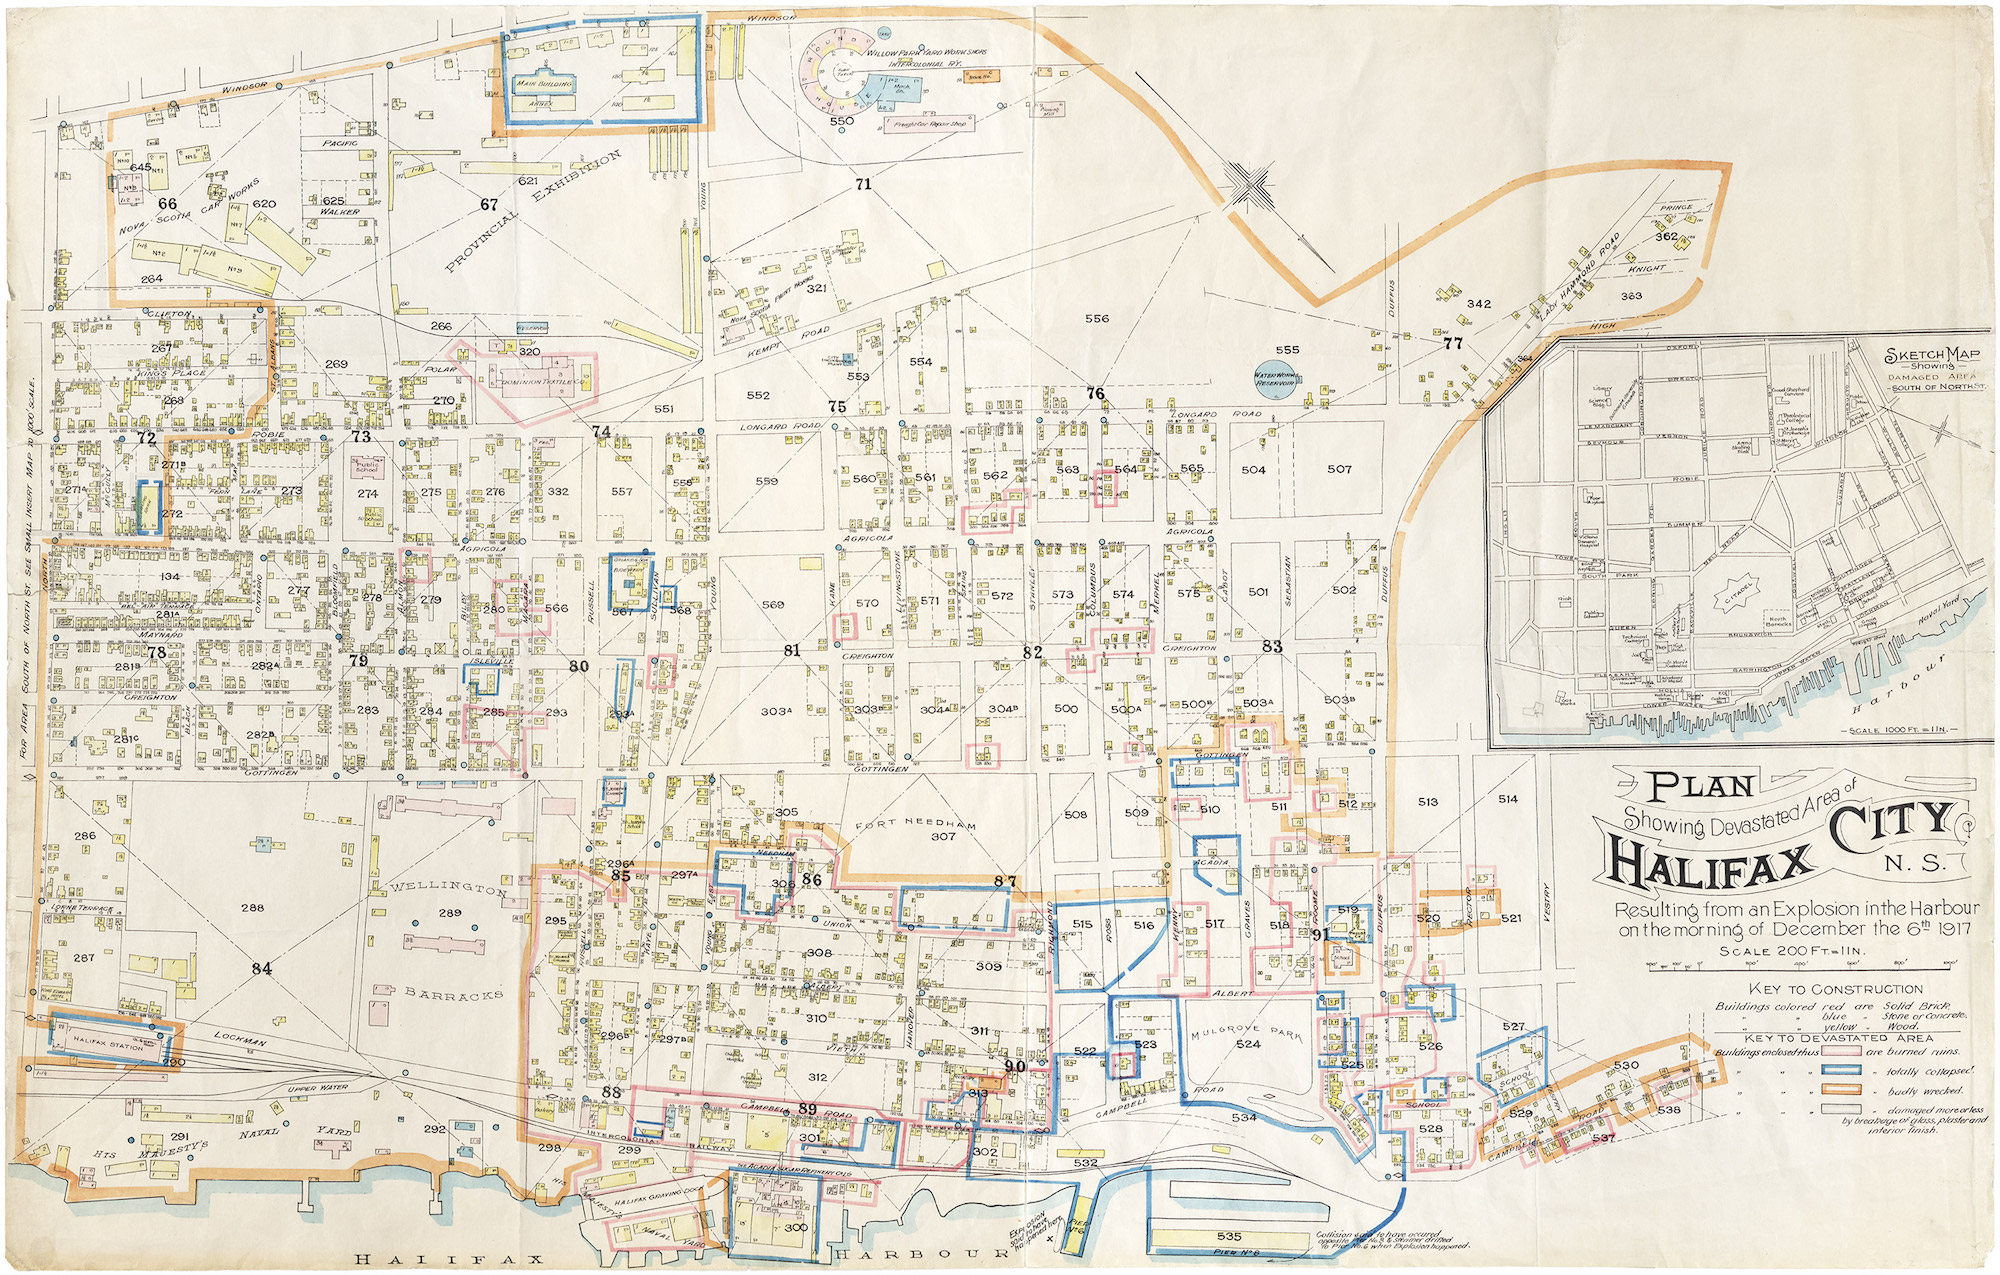
caption
Fred Vallance-JonesStudents in the master of journalism program at King’s used ArcGIS Pro, a GIS program, to georeference the original map. Georeferencing is a process by which the locations on the historic map are matched to locations on a present-day digital map, allowing it to be lined up to the digital world, so to speak. From there, the students used tools in the program to manually draw the more than 1,000 individual buildings depicted on the devastated area map, and enter key attributes such as the property addresses.
The features on the map were then split into separate layers depicting properties of various levels of destruction after the explosion. We used the destruction categories as depicted on the historic map.
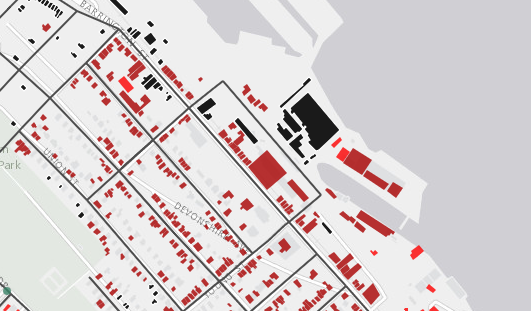
The result is a digital version of the same map.
We knew that the damage was not limited to the officially designated devastated area, so we searched in the Nova Scotia Archives for records that might have systematically recorded such information. Fortunately, the Halifax Relief Commission kept extremely detailed records of its activities, and in the first few months of 1918, the commission sent inspectors to survey the damage to individual properties. The forms the inspectors filled out broke down various types of repairs that were needed and provided an estimate of the value of each building pre-explosion.
Information transcribed
Students from the third-year advanced reporting class took on the task of transcribing key information from these forms into a spreadsheet, with each student being responsible for between 50 and 120 addresses. Their work was combined into one master sheet, and the addresses and values were then placed on the digital damage map as points, through a process called geocoding.
A ratio of the value of repairs required compared to the original value of the property was calculated and this was then used to provide the colour coding on the map. It was felt a ratio of value was most appropriate as the repairs required would have been, to at least some degree, related to the size and value of the building before the disaster.
A radius of two kilometres from the explosion location was chosen for this work as this was achievable in the time available.
The addresses were geocoded based on the street map of the day, and address ranges obtained from the 1917 city directory.
The second map on the main page shows the number of people who died in the explosion who lived at different addresses across the Halifax peninsula. The address information comes from the online Halifax Explosion Remembrance Book maintained by the Nova Scotia archives. The most recently revised version was used.
As this geocoding exercise involved properties throughout the peninsula, multiple sources were used to locate the points. These were the polygons manually drawn of devastated buildings, as described above, ranges of addresses from the 1917 city directory, and in a limited number of cases, address points from today obtained from the Halifax open data site and then converted back to historic addresses using the region’s conversion file, also available online. Any points located this way were checked against the city directories of the time for accuracy.
Patrick Cain of Global News used the geocoded points produced by the King’s classes as the basis for his map of the casualties of the Halifax Explosion.
Third year and masters students did additional archival research and interviews to produce the final package you are reading today.