Standing Still has its roots in May 2018, when the CBC published a story documenting a delay of almost two days of the Canadian in western Canada. We wondered, how often does that happen?
That question resulted in a year-long data project.
The project team obtained data on the performance of long-distance trains from Via’s real-time on-time-performance site at http://tsimobile.viarail.ca. The site provides the geographic location of each train in Via’s network, refreshed about once every minute by means of a data file in JSON format.
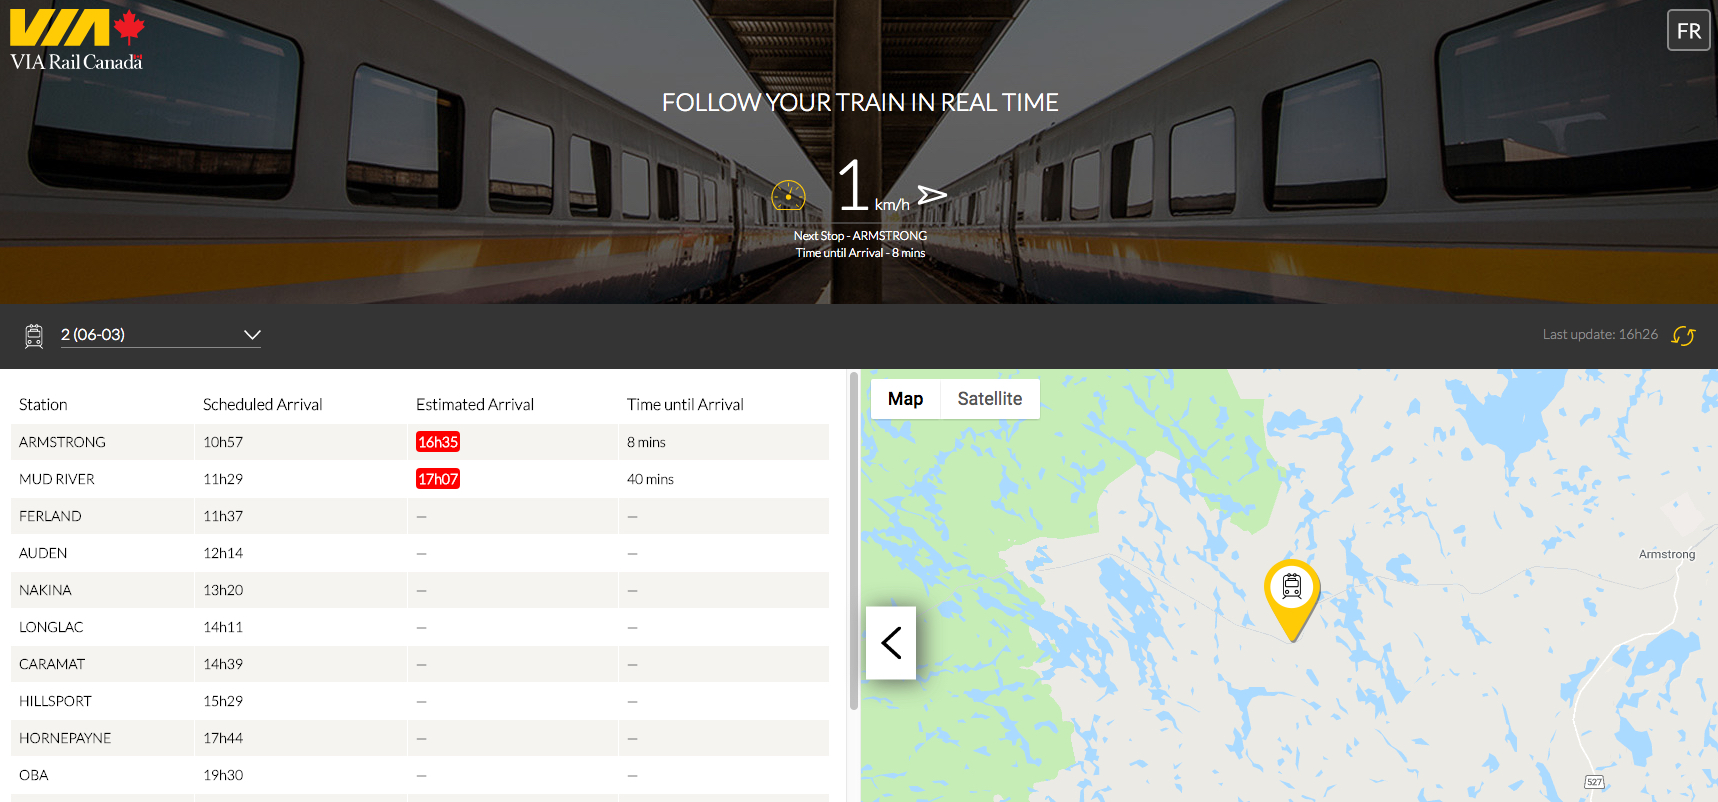
caption
Via Rail’s online on-time-performance site shows the Canadian arriving almost six hours late in Armstrong, Ont, June 6, 2019.The King’s team used scripts written in the Python programming language to capture the JSON data about once every ten minutes (15 minutes in the first two weeks), along with the timestamp of when the data was captured. The JSON data was later parsed into csv files by another Python script.
Data was collected over the 12 approximately months of the project. Each data record, or row, contained all of the information for the current position for one train, what we called a “location fix.” For each fix, the data included columns for the train number, the speed the train was reported to be going, the latitude and longitude coordinates of the train, the next scheduled station stop, the scheduled time of arrival at that station, the estimated time of arrival as calculated by Via, the number of minutes behind or ahead of the scheduled time as calculated on the fly by our script and the number of minutes until the train was to arrive at the next stop, also calculated by the script and based on Via’s estimated arrival time. The minutes behind schedule and the estimated times of arrival were also available as part of Via’s data, but we calculated our own because Via did not provide a calculation of the number of minutes a train was ahead of its schedule, indicating 0 minutes in such instances, and the estimated time of arrival information appears in the JSON file in a non-standard text format rather than a numeric format. We compared the times our script calculated and they matched Via’s calculations. Each time we captured a location fix, we also added the current time to the file.
No data was collected for the following periods: 19 days prior to March 26, 2019, 10 days prior to February 11, 2019, five days prior to December 21, 2019, and two days each prior to July 3, 2018 and June 25, 2018. There were intermittent shorter gaps in collection. The data was generated automatically and it proved relatively clean, except for some erroneous locations, as discussed below.
Analysis was done in a MySQL database, Microsoft Excel and ArcGIS Pro.
Departure and arrival times at terminal and en-route stations, and duration of trips, were calculated using the first and last times reported for a train after its departure. This provided results within about 10 minutes at either end of a run. These were then checked against archived on-time information available from Via Rail’s main website.
For the key calculation of timeliness of trains, we applied Via Rail’s standards. A train was deemed to be late if it fell outside of the 60 minute grace period Via allows for its long distance trains. Trains that arrived within 60 minutes of the scheduled time were considered on-time for the purposes of the analysis. If a train was at least 10 minutes early, it was deemed to be early.
Locations where trains waited for extended periods were identified using SQL queries that grouped locations for which a train had a speed of 0 and the same latitude and longitude coordinates were recorded two or more times. An approximate time spent waiting was calculated based on the time that elapsed between location fixes. As the data was not always reliable in more remote areas, the calculation was done for the Prairie provinces only. Stationary locations were discarded from this analysis if the train would have had to travel at a speed greater than 90 km/h to reach the next recorded location after the stationary position. The reason we did this is explained below. The data was imported into ArcGIS Pro and any positions within 2 km of a Via Rail station stop were also removed, to avoid confusion with station stops. The data was exported as a shapefile and uploaded to ArcGIS Online for display. A screenshot was made of the map and included in the story.
To create the two maps showing the progression of specific trains, MySQL and Excel were used to create a table of the earliest location fix at each location for each train. If a location was reported more than once–because the train was stopped or was in a remote area with poor cellular reception (see below)–only the first occurrence of that location was included in the data for the map.
The local time for each fix was calculated by using GIS software to place each location into the appropriate time zone, and then MySQL to calculate the local time based on the timestamp for each location fix. The maps and calculated local times were checked manually against archived Via on-time-performance information. The finished data was imported into ArcGIS Pro, and then a shapefile was created for upload to ArcGIS Online for display.
To compare the pre-July 26, 2018 schedules of the Canadian to the schedules that came into effect that day, the arrival times at each station were compared in an Excel spreadsheet, and the number of minutes earlier or later than the previous schedule was calculated. As the eastbound train left Vancouver at a different time in the new schedule, the departure time in the new schedule was converted to be the same as in the old schedule, and all subsequent times adjusted based on that converted time. Total running times for trains were calculated based both on the collected data and manual calculations from printed timetables.
There are limitations to the analysis. Most importantly, the information provided is only as accurate as the original data we obtained online.
We took steps to assess that accuracy. We rode a limited number of Via trains and compared the locations being provided by the online system with what we observed the location of the train to be and found the system to be providing accurate locations most of the time. However, there were times when the system did not report the current location properly and would instead report another location.
Upon examining the collected data, the principal anomaly we found was the identical location and speed repeatedly being reported through a number of location fixes, followed by an impossibly large distance to the next location. This showed up during examination of the data using GIS software as there were large geographic gaps, particularly in northwestern Ontario. It became apparent in these cases that the train had not actually been stationary, but that the JSON file contained an earlier latitude/longitude pair that was being used to populate the online map. Even while the displayed position remained the same, the system continued to provide expected arrival times for each station along the way. We asked Via about this and it provided this statement:
The Train Status Information system is dependent on GPS signals. This technology operates with the support of a cellular network, and coverage is not optimal in certain remote locations along the route.
Because of this limitation, you will notice some gaps in coverage on the individual train maps.
The principal data findings of the analysis related to Via train schedules and timeliness were shared with Via, which confirmed their accuracy.
The data-driven aspects of this project were supplemented by traditional reporting and interviews.
The King’s MJ class worked on this project throughout the fall and into the winter of the 2018-19 school year and many of the calculations and methods were devised during that time and were part of the students’ instruction. Further data collection, analysis, data checking and visualization was completed in the spring and summer of 2019 by the supervising instructor.
The King’s MJ program provides intensive instruction in data and digital journalism techniques such as those used for this project.